PrEP is a key HIV prevention strategy in addressing the HIV epidemic1,2
In the US, coverage for oral and injectable PrEP is required without patient cost-sharing3,4
PrEP is a USPSTF Grade A service covered by most commercial plans and Medicaid expansion programs without cost-sharing or coinsurance
While great progress has been
made, there were still
39,000+
new HIV diagnoses in the US
in 2023.2,a
a(CDC, 2023. Estimated HIV diagnoses in the US and 6 territories and free states for individuals aged ≥ 13 years.)
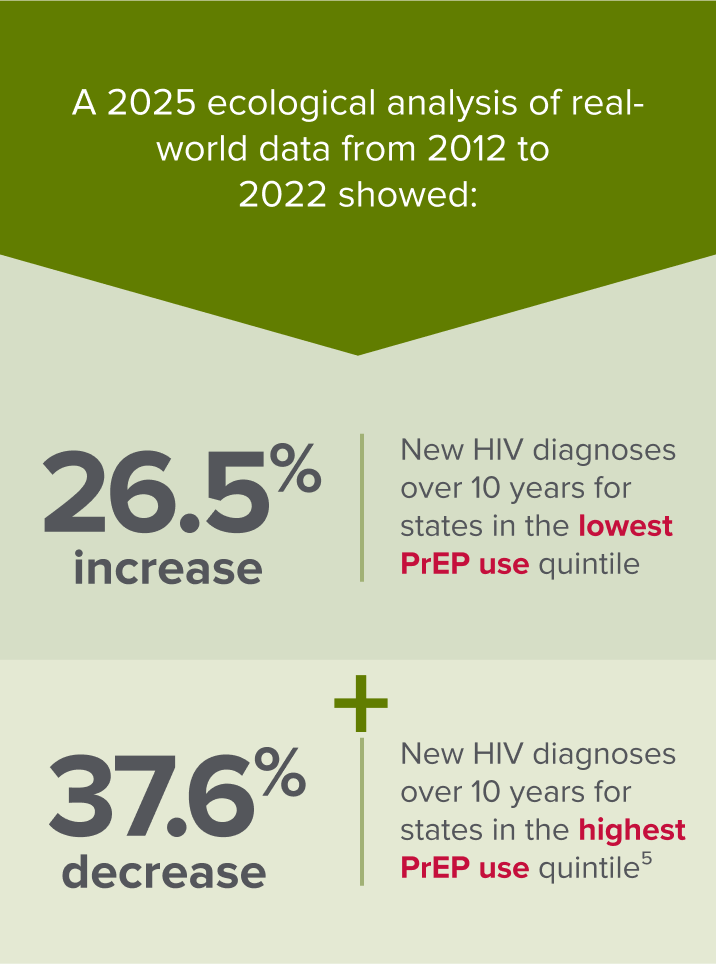
Real-world PrEP use in the US*†‡ was significantly associated with a decrease in new HIV diagnoses over a period of 10 years5
*Among people ≥ 13 years of age indicated for PrEP from 2012-2022.
†In 33 jurisdictions (32 states and District of Columbia) for which there are complete laboratory reporting of HIV viral suppression data for ≥ 3 years from 2012 through 2022.
‡Data shown for quintiles below do not represent estimated decade percent change (EDPC) for individual states.


In the real-world setting, substantial decreases in US HIV diagnosis rates have occurred among people who have been prescribed PrEP vs not prescribed PrEP6

In an analysis of longitudinal prescription and diagnosis data, the US HIV diagnosis rate was 61% lower among adults who were prescribed PrEP from October 2019 to June 2021 vs those not using PrEP in 20196
A large, real-world study examined PrEP use among ~14,000 adults in the US who received PrEP care during a 6-year period7*†
*The 2021 retrospective cohort analysis used electronic health records data from a Northern California integrated health system; prescriptions were filled for PrEP medications for adults (≥18 years of age) with an indication for PrEP.
†N=13,906.
Among individuals engaged with PrEP care at any point during the retrospective study period (July 2012 to March 2019):
- 52.2% of those initiating PrEP discontinued at least once during the study period7
- 60.2% of those who discontinued reinitiated PrEP before the end of follow-up7
The study also revealed HIV incidence rate estimates were highest among individuals who were prescribed PrEP and did not initiate, as well as those who discontinued and did not reinitiate PrEP7
| PrEP status | # of HIV infections / Total # of individuals | Total follow-up, person-years | Incidence (95% CI), per 100 person-years |
|---|---|---|---|
| Overalla | 91/13,861 | 26,210 | 0.35 (0.28-0.43) |
| Linked but not prescribed PrEP | 36/3013 | 4119 | 0.87 (0.63-1.21) |
| Prescribed PrEP but did not initiate | 13/811 | 1226 | 1.06 (0.62-1.83) |
| Discontinued but reinitiated PrEP | 4/1082 | 1420 | 0.28 (0.11-0.75) |
| Discontinued and did not reinitiate PrEP | 38/2108 | 2973 | 1.28 (0.93-1.76) |
| Persistent on PrEPb | 0/5367 | 9139 | 0.00 (0.00-0.04)c |
aExcludes individuals who were diagnosed with HIV during the eligibility assessment at PrEP linkage.
bPersistent on PrEP refers to individuals who initiated and remained on PrEP throughout follow-up.
cOne-sided 97.5% upper CI.
For some individuals, PrEP discontinuation may reflect a decrease in HIV risk and is a deliberate decision.
However, HIV incidence among those who discontinued PrEP and did not reinitiate and the higher rates of discontinuation in key subgroups disproportionately affected by HIV suggest broader systemic barriers.7
According to the CDC, efforts must be further strengthened and expanded to reach all populations equitably8
Maintaining open access for all PrEP options, including long-acting modalities, is important to minimize barriers that may stand in the way of PrEP utilization and to accommodate diverse individual needs and risk profiles
- Centers for Disease Control and Prevention. HIV prevention in the United States: mobilizing to end the epidemic. Published October 2021. Accessed April 16, 2025. https://stacks.cdc.gov/view/cdc/103438
- Centers for Disease Control and Prevention. HIV diagnosis, deaths, and prevalence: 2025 update. Published April 29, 2025. Accessed May 8, 2025. https://www.cdc.gov/hiv-data/nhss/hiv-diagnoses-deaths-and-prevalence-2025.html
- US Preventive Services Task Force. Preexposure prophylaxis to prevent acquisition of HIV: US Preventive Services Task Force recommendation statement. JAMA. 2023;330(8):736-745
- US Preventive Services Task Force. Procedure Manual Appendix. Accessed March 4, 2025. https://www.uspreventiveservicestaskforce.org/uspstf/about-uspstf/methods-and-processes/procedure-manual/procedure-manual-appendix-i
- Sullivan PS, Juhasz M, DuBose SN, Le G, Brisco K, Islek D, Curran J, Rosenberg E. Association of state-level PrEP coverage and new HIV diagnoses in the USA from 2012 to 2022: an ecological analysis of the population impact of PrEP. Lancet HIV. 2025;12(6):e440-e448. doi:10.1016/S2352-3018(25)00036-0
- Tao, L. et al. Real-world geographic variations of HIV diagnosis rates among individuals prescribed and not prescribed oral HIV pre-exposure prophylaxis regimens in the United States. Poster presented at IDWeek conference; October 19-23, 2022; Washington, D.C. Poster 1482
- Hojilla JC, Hurley LB, Marcus JL, et al. Characterization of HIV preexposure prophylaxis use behaviors and HIV incidence among US Adults in an integrated health care system. JAMA Network Open. 2021;4(8):e2122692. doi:10.1001/jamanetworkopen.2021.22692
- Centers for Disease Control and Prevention. Expanding PrEP coverage in the United States to achieve EHE goals. Published October 17, 2023. Accessed September 8, 2025. https://www.cdc.gov/nchhstp/newsroom/releases/2023/2021-hiv-incidence.html
